

Concordant phylogenies
Using MEGA
Introduction:
-
We have mentioned a number of times that different genes will often show differing evolutionary histories and therefore a number of genes and non coding regions should be used to determine the evolutionary history of a species. In this exercise you will be investigating the question: How does the inferred evolutionary history of a set of taxa change when you compare a nuclear gene tree with a mitochondrial gene tree?
Materials required:
-
MEGA installed on your computer.
-
List of species to find on GenBank (alternatively we have provided .meg files as follows: ‘10_mammal_cytb.meg’ which provides a nuclear data set, and ’10_mammal_RAG1.meg’ which provides a mitochondrial data set)
-
Objectives:
-
Gain a greater skill in searching for sequence data using MEGA, aligning sequences, and creating simple phylogenetic trees
-
Create two phylogenetic trees for a group of 10 mammal species, one for a mitochondrial gene (cytochrome b) and one for a nuclear gene (recombination activation protein).
-
Steps:
-
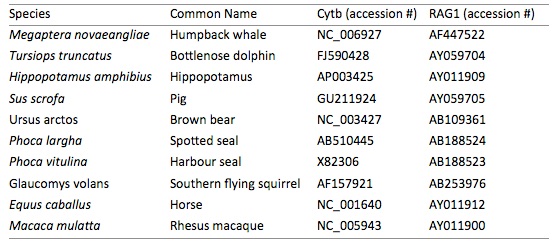
1.Use the alignment module of MEGA to search GenBank (Query GenBank) for the genes and species from the following table. For each gene you will need to create a separate alignment file in MEGA. We have provided the GenBank accession numbers for the sequences used in the .meg files provided. If you are using the .meg files provided, please skip to step 3.
-
-
-
-
-
2.When you have downloaded all the species for a gene, align them using Clustal W option (use defaults) and export the file as a MEGA file.
-
3.Open the .meg file
-
4.For each data set construct a phylogenetic tree using the neighbour-joining method (kimura-2 parameter), pairwise deletion, and 500 bootstrap replicates. You can save the tree in a variety of formats to compare when both trees have been built, as MEGA will only work with a single data set at a time.
-
-
Questions:
-
1.Are the two trees different or the same?
-
2.Explain why there may be differences between the two trees. If there is no difference, suggest why this is the case.
-
3.Do the bootstrap values show that your trees are well supported? Explain.
-
4.Which tree is a better representation of the evolutionary history of the taxa? Use published material to support your decision.
-
-
-
Additional reading:
-
Arnason, U., J.A. Adegoke, K. Bodin, E.W. Born, Y.B. Esa, A. Gullberg, M. Nilsson, R.V. Short, X. Xu, and A. Janke. (2002) Mammalian mitogenomic relationships and the root of the eutherian tree. PNAS 99: 8151-8156 (doi: 10.1073/pnas.102164299)
-
Murphy, W.J, E. Eizirik, W.E. Johnson, Y.P. Zhang, O.A. Ryder and S.J. O'Brien. (2001) Molecular phylogenetics and the origins of placental mammals. Nature 409: 614-618 (doi:10.1038/35054550)
